Publication Date:
- Stefan Rayer, PhD, Bureau of Economic and Business Research, Population Program Director
An earlier BEBR article, Asians in Florida, published in 2014, found that Asians were the fastest growing racial group—in percentage terms—in Florida and the United States from 2000 to 2010. At the time, the data from the U.S. Census Bureau’s American Community Survey (ACS) were only available through 2012, but they showed that growth continued after 2010, with the Asian population growing faster than most other racial groups in both Florida and the United States. The ACS data are now available through 2015, and this study provides an update on the earlier piece. In addition, this article examines the components of population change—births, deaths, and migration—that have effected the growth in Florida’s Asian population. Unless noted otherwise, all references to the “Asian” population in this article refer to the “Asian alone” population and exclude multiracial persons (e.g., Asian and white).
Table 1 shows 2010–2015 data by race for Florida and the United States. For 2010, the table displays both the decennial census counts and 1-year estimates from the ACS. While for total population the two data sources are quite close, they show differences for individual race groups. Compared to the 2010 Census, the 2010 ACS 1-year estimates show higher numbers and proportions of persons who classified themselves as white alone, while the “some other race alone” and the “two or more races” categories show lower numbers and proportions. The differences between these two data sources are not as pronounced for the Asian population, but for better comparability the population changes from 2010 to 2015 shown in the rightmost panel of Table 1 were calculated based on the 2010 1-year ACS estimates rather than the 2010 decennial census counts. As one can see, the growth of the Asian population continued in both Florida and the United States. Apart from the “two or more races” group, the Asian population was the fastest growing racial group from 2010 to 2015 in Florida and the United States, growing by about 20% in Florida and by just over 17% nationwide.
Figure 1 shows population estimates for the total Asian population and for the following seven Asian subgroups: Asian Indian, Chinese (including Taiwanese), Filipino, Japanese, Korean, Vietnamese, and other Asian. The figure displays all currently available 1-year ACS data from 2005 to 2015. The scale on the right is for the total Asian population, while the scale on the left is for the seven subgroups. Florida’s total Asian population increased by almost 50% from about 370,000 in 2005 to over 540,000 in 2015; most of the subgroups showed an upward trend over the ten year period as well. As can be seen in the chart, the year-to-year changes fluctuated for many of the subgroups, sometimes widely.
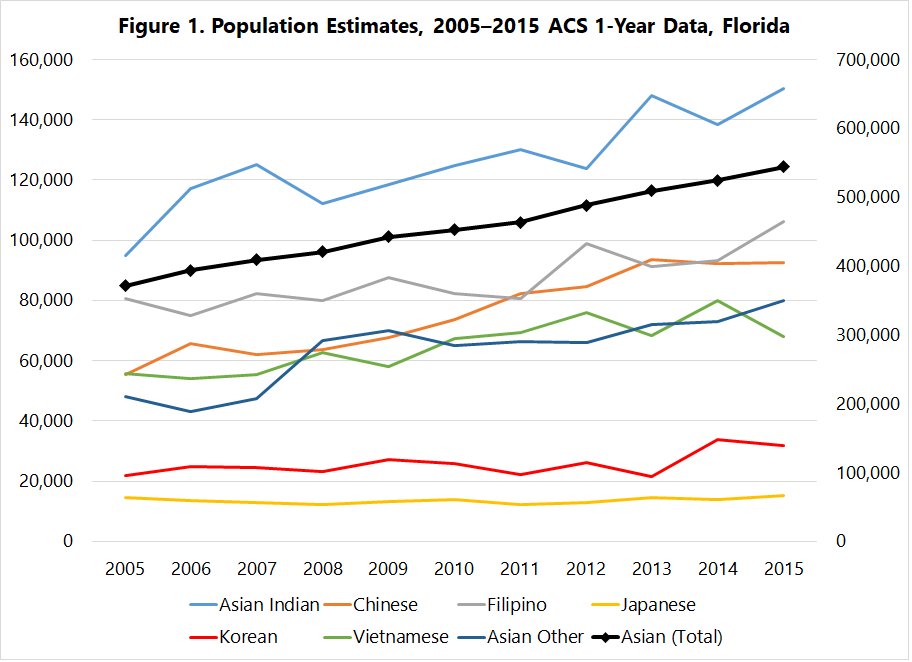
The ACS questionnaire gets distributed to a random sample of approximately 295,000 addresses each month nationwide. Being sample-based, the ACS estimates include a margin of error, which tends to be larger (in percentage terms) for smaller populations. To give an example, in 2015 the ACS estimate for the total Asian population was 544,068 and the margin of error was +/- 8,941 (or about +/- 1.6%); the margin of error for the Filipino population was almost as large numerically (+/- 8,456), but with an estimated population just under one fifth of the total Asian population (106,181 in 2015) the margin of error was +/- 8% in percentage terms (data not shown). While Figure 1 shows an upward trend from 2005 to 2015 for both groups, the year-to-year changes fluctuate much more for the Filipino population.
In addition to the 1-year ACS estimates, the Census Bureau also publishes multiyear ACS estimates that combine several years of data. These include a larger sample of the population and consequently tend to fluctuate less. Because of that, the multiyear ACS estimates are particularly useful for examining changes in smaller populations. The earlier BEBR article on the Asian population utilized data from the 3-year ACS through 2010–2012. Unfortunately, the 3-year ACS data were discontinued in 2013, and only 1- and 5-year ACS data have been available since then. Figure 2 is similar to Figure 1, but uses three sets of 5-year ACS data for 2005–2009, 2008–2012, and 2011–2015. The 2005–2009 data are the earliest 5-year ACS data available, and the 2011–2015 data are currently the most recent ones; the 2008–2012 data provide a midpoint centered on the year 2010. While both figures reveal a similar overall trend, the 5-year ACS data fluctuate much less than the 1-year data. Figure 2 shows that the increases from 2005–2009 to 2011–2015 were greatest for the five largest Asian subgroups (Asian Indian, Chinese, Filipino, Vietnamese, and other Asian); in contrast, the Japanese and Korean populations showed little growth over that period. These patterns are confirmed by a statistical analysis that takes the margin of error of the ACS estimates into consideration: For all groups but Japanese and Koreans, the population changes between 2005–2009 and 2011–2015 were statistically significant (data not shown).
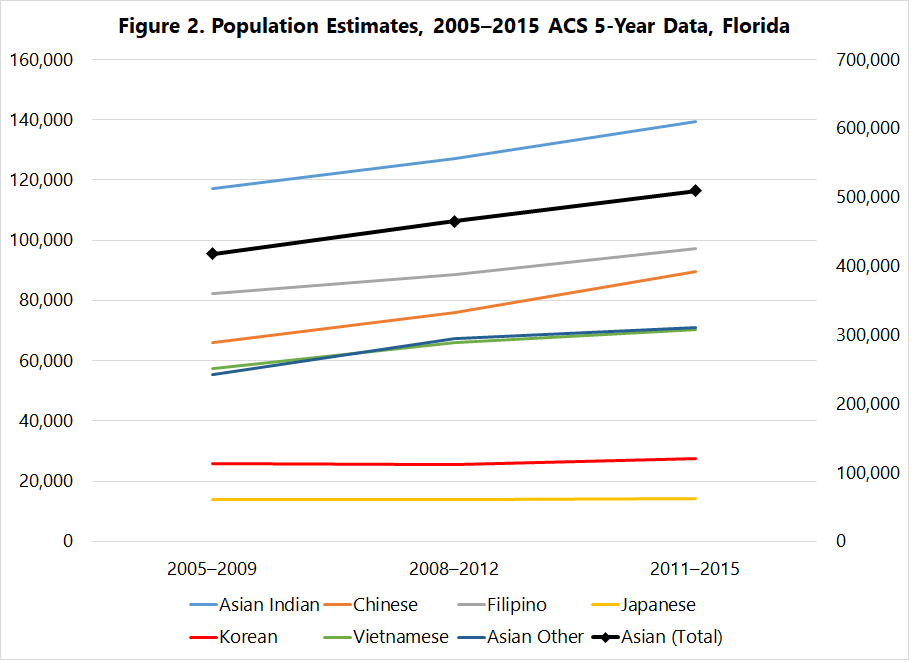
Taken together, how much growth was there for the Asian population in Florida? According to the 1-year ACS, annual growth varied between 10,000 in 2009–2010 and 25,000 in 2011–2012, averaging about 17,000 per year over the 10-year period from 2005 to 2015. The 5-year ACS data indicate slightly lower growth of about 15,000 persons per year. If we also consider the margin of error associated with the ACS estimates, the range grows wider, to about 14,000 to 19,000 per year. Consequently, although the exact number is unknown, an average annual growth of about 15,000 to 17,000 persons per year seems to be a reasonable range.
What accounted for this growth of the Asian population in Florida? A population can grow or decline through three demographic processes: births, deaths, and migration. The difference between the number of births and the number of deaths in an area over a particular period of time is called natural increase. Natural increase can be positive (when births exceed deaths) or negative (when deaths exceed births); the latter is often called natural decrease. With respect to migration, one can differentiate between people moving into an area (in-migration) and people leaving an area (out-migration), and between domestic and foreign migration.
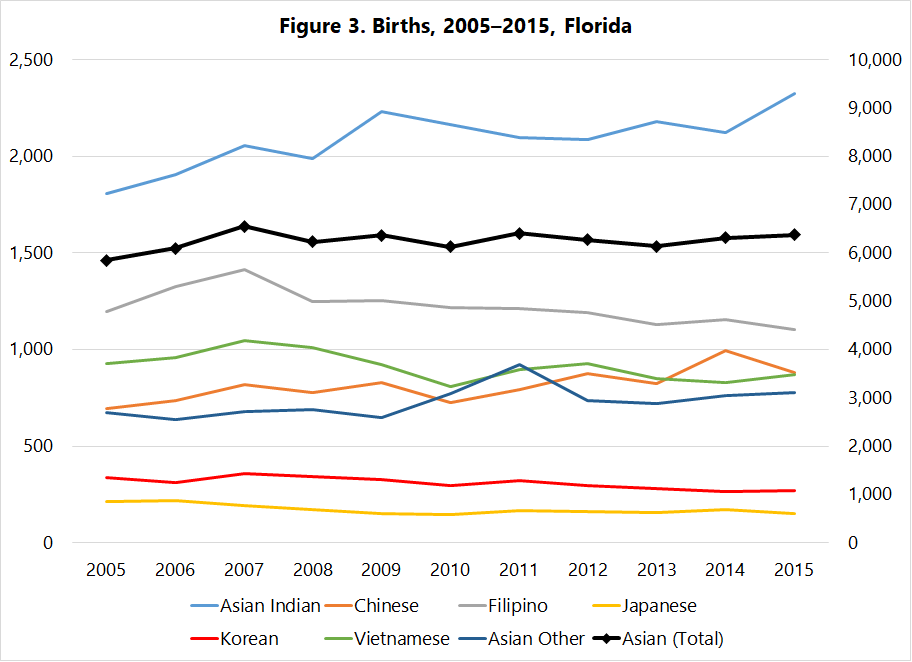
Figures 3, 4, and 5 graph resident births, resident deaths, and natural increase for the total Asian population and the seven Asian subgroups from 2005 to 2015 for Florida. The data come from the Florida Department of Health’s FloridaCHARTS.com birth and death query system. Similar to Figures 1 and 2, the scale on the right in Figures 3–5 is for the total Asian population and the scale on the left is for the seven subgroups. Figure 3 shows that, in contrast to the rather strong upward trend for the total Asian population (Figures 1 and 2), the number of births to Asians increased only modestly over that 10-year period, from about 5,800 in 2005 to about 6,400 in 2015. Among the subgroups, Asian Indians recorded the largest number of births, which increased over this period, while Japanese and Koreans had the fewest births, which showed a small downward trend. Many of the groups exhibited ups-and-down in the number of births from year-to-year. Although the birth data are not sample-based, the numbers involved are quite small, which can result in such fluctuations.
The number of resident deaths increased for the total Asian population and for all seven subgroups over that period (see Figure 4). For the total Asian population deaths doubled from about 800 in 2005 to 1,600 in 2015, while for Asian Indians the number of deaths almost tripled. While these increases look impressive, it should be noted that the total number of deaths amounts to no more than a few hundred a year for each group, and annual fluctuations are to be expected, even more so than with the birth data.
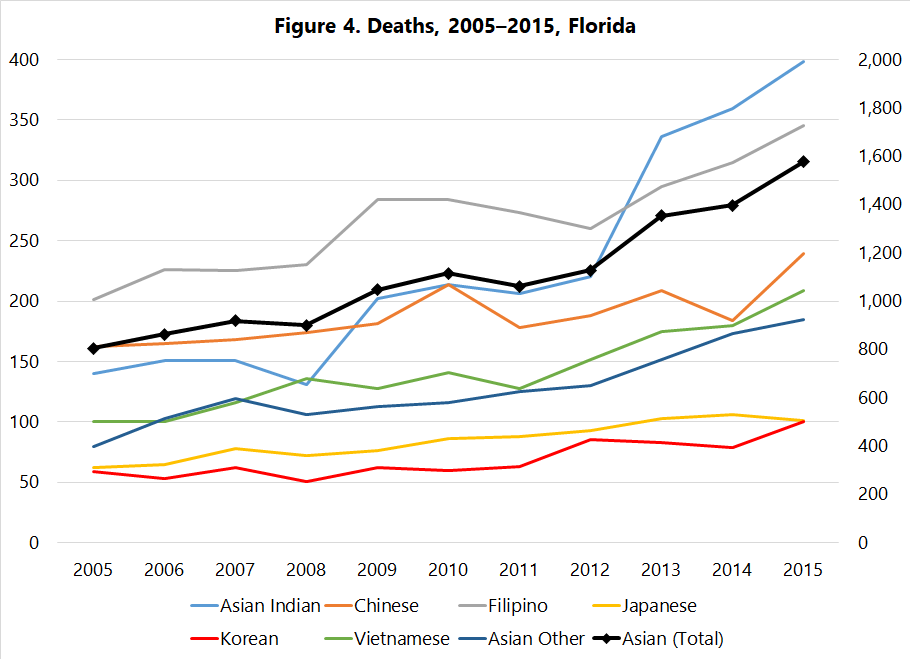
Figure 5, which shows natural increase, is rather similar to the chart for births (see Figure 3). This is because, while the number of deaths for the Asian population has been increasing, it is still much smaller than the number of births; by 2015 there were four times as many births than deaths. All seven Asian subgroups had positive natural increase, though for the Filipino, Japanese, Korean, and Vietnamese populations—as well as for the total Asian population—the balance of births over deaths became smaller over time.
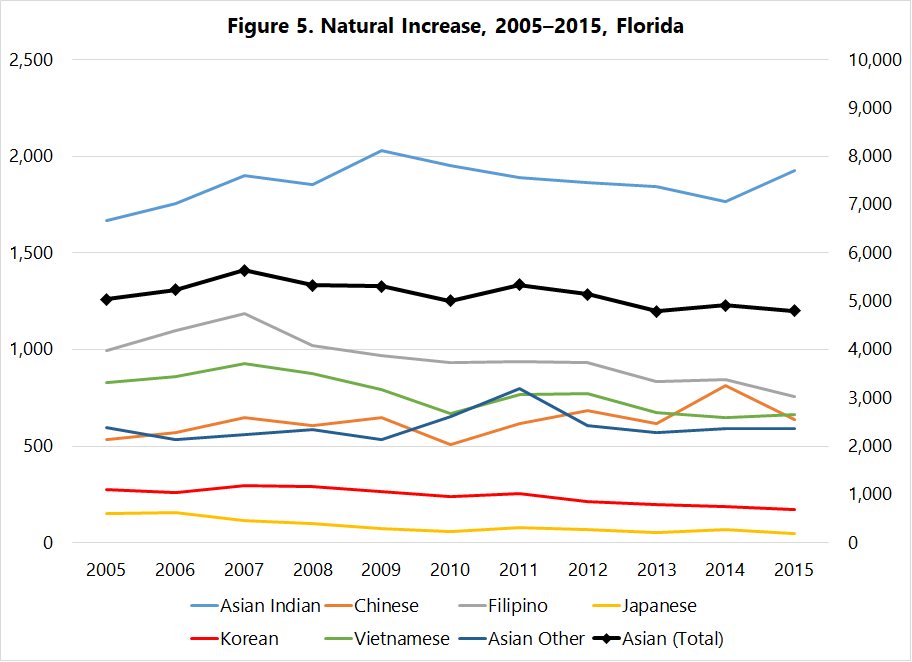
What do these vital statistics data imply for population change of the Asian population? Figure 5 shows that, on average, the Asian population grew by about 5,000 persons per year through natural increase between 2005 and 2015 in Florida. As stated above, the average annual growth of the total Asian population amounted to about 15,000 to 17,000 persons. Thus, natural increase accounted for roughly one third of overall growth of the Asian population between 2005 and 2015. This percentage is somewhat higher than for the total population in Florida, for which natural increase contributed about one quarter of overall growth over that period (data not shown).
If about one third of overall growth of the Asian population in Florida between 2005 and 2015 came from natural increase, then migration must have accounted for the remaining two thirds. Table 2 reveals that during the first two periods (2005–2009 and 2008–2012), Florida’s population increased by about 40,000 to 50,000 per year through domestic migration; in addition, the state recorded an inflow from abroad of about 150,000 persons per year. During the period 2011–2015 both domestic net migration and foreign in-migration increased, reflecting the recovery from the Great Recession. Even though the proportion of total in-migration from abroad increased from about 22% to 26% over the period, the majority of all in-migrants to Florida came from other states rather than from abroad. The ACS does not include data on out-migration (or emigration) to other countries, and it is therefore impossible to calculate a net migration figure for foreign migration comparable to that for domestic migration. However, emigration from the United States to other countries is commonly assumed to be relatively small—representing about 20% to 30% of the total inflow from abroad—so it is likely that the net gains from foreign migration were larger than those from domestic migration.
With respect to the Asian population, Table 2 shows that virtually the entire growth appeared to be due to migration from abroad. Except for the first period 2005–2009, when domestic migration accounted for a net gain of about 3,000 persons per year, the ACS migration data indicate that there were as many (or more) Asians moving from Florida to other states than vice versa. Migration from abroad accounted for a larger proportion of the total migration inflow for the Asian population than for the total population, and the proportion increased over time, from about 43% in 2005–2009 to 54% in 2011–2015. Asians accounted for about 2.5% to 3.5% of the total domestic in- and out-migration flows, and for about 9% of the total migration flow from abroad. Migration flows for the seven Asian subgroups varied widely. For Asian Indians, Chinese, Filipinos, and other Asians the share of the total inflow from abroad increased over time, exceeding 50% by 2011–2015; for Japanese and Vietnamese it decreased; and for Koreans it remained constant (data not shown).
How do these ACS migration estimates align with the overall population changes and the growth from natural increase? If we assume a total population change of about 15,000 to 17,000 persons per year for the Asian population in Florida between 2005 and 2015, and a positive natural increase of about 5,000 per year, then the migration contribution should be in the range of 10,000 to 12,000 per year. Adding the domestic net migration and foreign in-migration values from Table 2 together results in average annual gains of about 14,000 to 16,000 persons. Assuming emigration to abroad amounting to between 20% and 30% of immigration, this would imply net gains from migration of about 10,000 to 13,000 persons per year. These levels of net migration correspond quite closely to the residual between overall population change and natural increase.
In summary, this article has attempted to account for the components of population change for the Asian population in Florida using data from the U.S. Census Bureau’s American Community Survey and vital statistics data from the Florida Department of Health. The ACS estimates showed that the Asian population continued to grow quite rapidly in Florida in recent years. The majority—about two thirds—of that growth was due to migration, most of it from abroad, with natural increase contributing the remaining third.
While the components of growth added up quite nicely overall, several caveats to this study should be mentioned. First, the ACS population and migration estimates include margins of error, which make an exact accounting of the components of population change difficult. The Asian population in Florida is still relatively small. Although only state-level data were utilized, the 1-year ACS estimates often fluctuated quite widely from to year-to-year; the vital statistics data, which are not sample based, also showed significant year-to-year fluctuations. Assumptions also had to be made about who counts as Asian to be included in the study. The analysis focused on the Asian alone population, leaving out persons who identify with multiple races. This classification does not align perfectly with the birth data used in this analysis, which are by race of the mother. Thus, while births to multiracial mothers are not included, for births where the race of the mother and father differ, births to Asian mothers would be included but not births where the father is Asian and the mother is of another race.
Despite these caveats, the general trends discussed in this paper appear to be quite robust, and the decomposition of Asian population change into its components—births, deaths, and migration—contributes to our understanding of Florida’s changing demographics.
Acknowledgement: Ying Wang compiled the data used in this study.
Tables cited in this article can be found here: Table 1, Table 2