
- Ying Wang, Ph.D.
- Stefan Rayer, Ph.D.
Migration is the primary source of Florida’s population growth. In each decade since 1970, at least 80 percent of the state’s population growth was due to net migration, with the remainder accounted for by natural increase (the excess of births over deaths). The Great Recession of 2007–2009 resulted in reduced migration flows, especially from domestic sources, but migration has picked up again since 2010. According to 2015 population estimates from the U.S. Census Bureau, about 86 percent of total population growth since 2010 was due to net migration; domestic migration accounted for just over half of total net migration, and international migration accounted for just under half.
In this article we take a closer look at foreign in-migration patterns for Florida since 2005. Unless stated otherwise, all the data come from Public Use Microdata Sample (PUMS) files from the American Community Survey (ACS), a survey conducted by the U.S. Census Bureau. Although the data are collected on a continuous monthly basis, the numbers we report approximate an annual average for each of two 5-year periods: 2005–2009 and 2010–2014. Foreign in-migration refers to migrants from abroad and – unless otherwise indicated – excludes those from Puerto Rico and the U.S. Island Areas.
Foreign In-Migration to Florida
Table 1 shows Florida’s annual domestic and foreign migration flows for 2005–2009 and 2010–2014. Both the domestic in- and outflow decreased from the first to the second period. However, because domestic out-migration decreased much more strongly, domestic net migration more than doubled from about 42,000 per year in 2005–2009 to 90,000 in 2010–2014. The inflow from abroad increased from about 135,000 per year in 2005–2009 to 151,000 in 2010–2014; the inflows from Puerto Rico and the U.S. Island Areas also increased from about 16,000 in 2005–2009 to 22,000 in 2010–2014. It should be noted that ACS data cover both in- and outflows for domestic migrants, but do not cover outflows for foreign migrants. There are no comprehensive, reliable sources of data for emigration from the United States to other countries.
During 2005–2009, about 19 percent of the total migrants to Florida came from abroad, increasing to around 22 percent in 2010–2014. Migration from abroad, though, likely accounts for a much larger share of total net migration than these percentages would indicate. That occurs because ACS migration data do not include estimates of migration to other countries, which tends to be much smaller than domestic out-migration. This is supported by the Census Bureau estimates referenced above, which show an almost equal contribution from domestic and international migration to Florida’s total net migration since 2010.
Table 1. Annual Migration Flows to and from Florida, 2005–2009 & 2010–2014
|
Period |
Domestic In |
Domestic Out |
Domestic Net |
Foreign In1 |
From Puerto Rico and U.S. Island Areas |
Foreign In as % of Total In |
|
2005–2009 |
546,706 |
504,732 |
41,974 |
135,327 |
16,405 |
19.4 |
|
2010–2014 |
520,284 |
429,931 |
90,353 |
150,842 |
21,828 |
21.8 |
1 Excludes flows from Puerto Rico and U.S. Island Areas.
Table 2 displays the regional origins of foreign migrants to Florida. We aggregated individual countries of origin to broad regions of the world. The table also includes separate flows from Canada, Cuba, and Mexico, the three countries with the largest flows from abroad to Florida. In 2005–2009, the regions of the world sending the most migrants to Florida were Europe, Asia, and South America. By 2010–2014, Asia became the region sending the most migrants to Florida, followed by South America and the Caribbean excluding Cuba. We should point out that had we included Cuba with the Caribbean, this would have been the largest flow in both 2005–2009 and 2010–2014.
Reflecting geographic proximity and the patterns of past migration flows, in both periods about two-thirds of all migrants to Florida from abroad came from the Americas. However, the distribution of migrants from within the Americas shifted from the first to the second period, with shares of migrants from Mexico and Central America declining, those from Canada holding steady, and those from Cuba, the Caribbean, and South America increasing.
Table 2. Annual Migration from Abroad to Florida by Region of Origin, 2005–2009 & 2010–2014
| Region |
Migration Flow 2005–2009 |
Migration Flow 2010–2014 |
Percent of Total 2005–2009 |
Percent of Total 2010–2014 |
| Africa |
2,988 |
2,914 |
2.2 |
1.9 |
| Asia |
21,914 |
27,439 |
16.2 |
18.2 |
| Canada |
14,660 |
16,599 |
10.8 |
11.0 |
| Caribbean ex. Cuba |
16,541 |
23,538 |
12.2 |
15.6 |
| Central America |
9,897 |
7,648 |
7.3 |
5.1 |
| Cuba |
14,452 |
19,506 |
10.7 |
12.9 |
| Europe |
22,162 |
20,938 |
16.4 |
13.9 |
| Mexico |
13,714 |
6,116 |
10.1 |
4.1 |
| Oceania |
831 |
1,835 |
0.6 |
1.2 |
| South America |
18,168 |
24,309 |
13.4 |
16.1 |
| Total |
135,327 |
150,842 |
100.0 |
100.0 |
Table 3 shows the 15 largest migration flows from abroad to Florida during the two periods by country of origin. The PUMS data provide migration flows by country of origin, but the amount of detail provided varies by region of the world, and it can change over time (the 2010–2014 PUMS provide data for more countries than the 2005–2009 PUMS). To give an example, the 2005–2009 PUMS data provide separate flows for seven European and ten Asian countries, while only three South American countries are shown (Brazil, Colombia, and Peru). Countries for which no separate flows are provided are shown as regional aggregations (e.g. “South America, not specified”). It should be noted that these regional aggregations are not the same as the broader regions of the world shown in Table 2.
Among individual countries, Canada and Cuba led the rankings in both periods, followed by Mexico and Colombia. Other leading countries of origin included India, Brazil, Jamaica, and Germany. The 2005–2009 data did not include separate estimates for migrants from Haiti, a top 10 sending country in 2010–2014; Haitians were included in the “Caribbean and North America, not specified” category in the first period. The shifts in the origins of migrants from abroad over the two periods discussed above for broad regions of the world are also evident for countries; from 2005–2009 to 2010–2014 flows from several Asian and Caribbean countries moved up the rankings, while those from European and Central American countries generally went down.
Table 3. The 15 Largest Annual Migration Flows from Abroad to Florida by Country of Origin, 2005–2009 & 2010–2014
|
2005–2009 |
2010–2014 |
||||
| Rank |
Estimate |
Country | Rank |
Estimate |
Country |
|
1 |
14,660 |
Canada |
1 |
19,506 |
Cuba |
|
2 |
14,452 |
Cuba |
2 |
16,599 |
Canada |
|
3 |
13,714 |
Mexico |
3 |
13,911 |
South America, not specified |
|
4 |
11,388 |
Caribbean, not specified |
4 |
11,234 |
Caribbean, not specified |
|
5 |
7,129 |
South America, not specified |
5 |
6,116 |
Mexico |
|
6 |
4,825 |
Colombia |
6 |
5,643 |
Colombia |
|
7 |
4,071 |
Brazil |
7 |
5,350 |
India |
|
8 |
3,860 |
India |
8 |
4,808 |
Jamaica |
|
9 |
3,607 |
Germany |
9 |
4,709 |
Haiti |
|
10 |
3,409 |
Jamaica |
10 |
4,089 |
Brazil |
|
11 |
3,374 |
United Kingdom, excluding England |
11 |
4,046 |
Western Asia, not specified |
|
12 |
3,287 |
Guatemala |
12 |
3,879 |
China, Hong Kong, Macau & Paracel Islands |
|
13 |
3,075 |
England |
13 |
3,494 |
Germany |
|
14 |
2,932 |
Honduras |
14 |
3,153 |
Central America, not specified |
|
15 |
2,904 |
Philippines |
15 |
2,884 |
Philippines |
Foreign In-Migration to Florida Counties
Following the analysis of statewide patterns, we next look at the impact of foreign migration at the county level in Florida. We note that the PUMS data are only available for statistical entities called Public Use Microdata Areas (PUMAs). Larger, more populous counties often include several PUMAs, while two or more adjacent smaller counties may be combined into one PUMA. In order to analyze the foreign in-migration patterns at the county level, we allocated each PUMA to a specific county; a description of our allocation scheme is available by request.
Figure 1 shows the annual number of foreign in-migrants to each county in Florida. The size of the inflow from abroad is generally related to the population size of the county. Miami-Dade, Broward, Palm Beach, Orange and Hillsborough counties each received more than 5,000 migrants from abroad in both periods, while many of the smaller counties in the Florida Panhandle and in North Central Florida had an inflow of less than 100. Even though the total number of in-migrants from abroad increased from 2005–2009 to 2010–2014, there were fewer counties in the categories with annual flows exceeding 1,500 migrants and more counties in the category with fewer than 100 migrants. This is because much of the increase in migration from abroad from 2005–2009 to 2010–2014 was concentrated in the largest counties, especially in Miami-Dade, Broward, Orange, and Hillsborough counties, which increased their share of the state’s total foreign migrants over that period (see Table 4).
Figure 1. Annual Foreign In-Migration to Florida Counties, 2005–2009 & 2010–2014
a. 2005–2009
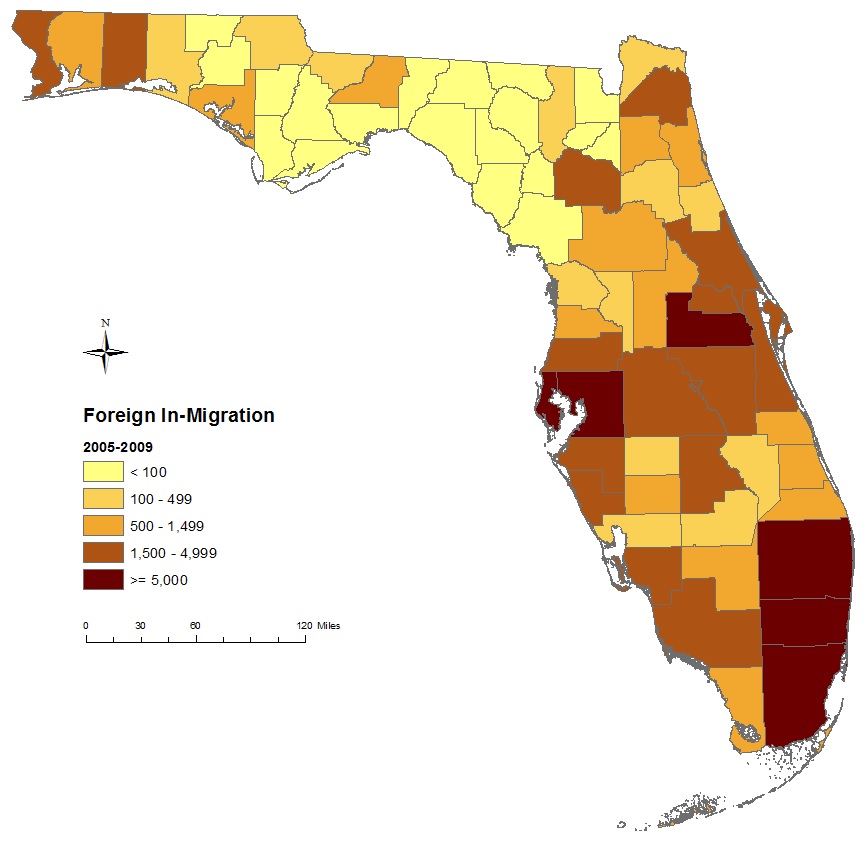

b. 2010-2014

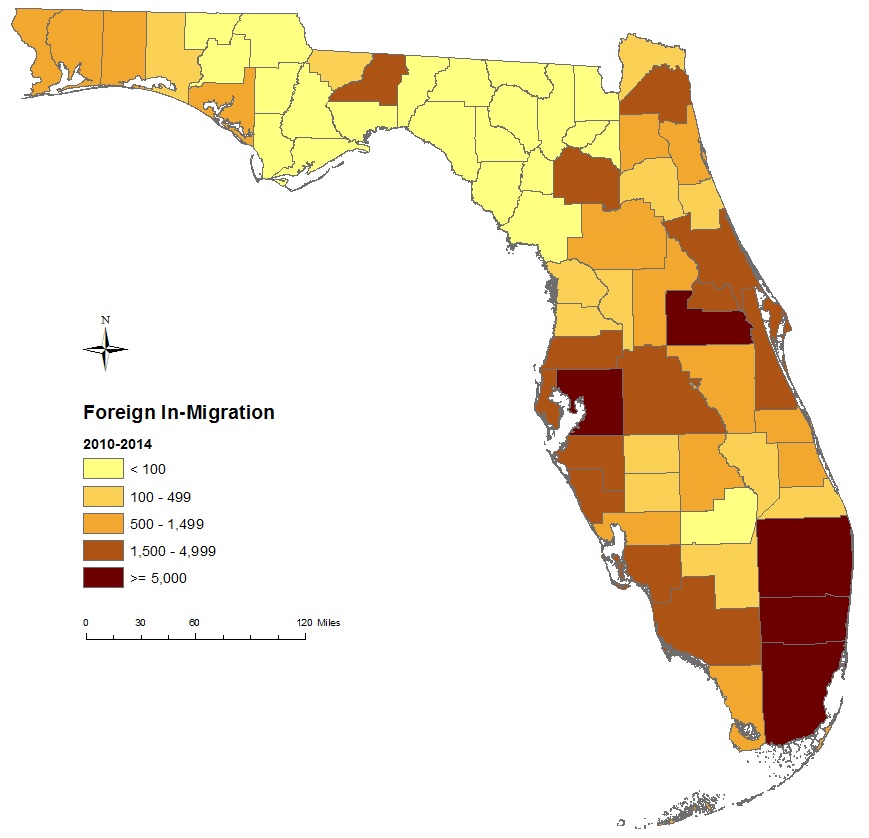
Table 4 shows that Miami-Dade County alone accounted for about one-quarter of the state’s total foreign in-migrants in 2005–2009; together with Broward and Palm Beach counties, almost half of all migrants from abroad moved to these three counties in southeast Florida. Miami-Dade, Broward, Palm Beach, Orange, and Collier counties also had larger shares of the state’s total in-migrants from abroad than their respective shares of total population. The ranking of the top 10 counties based on the number of foreign in-migrants remained rather stable between the two periods, with only Duval and Lee counties switching positions.
Table 4. The Top 10 Counties in Florida with the Largest Annual Inflows of Migrants from Abroad, 2005–2009 & 2010–2014
|
2005–2009 |
2010–2014 |
||||||||
|
Rank |
County |
Estimate |
Percent of State Migrants |
Percent of State Population 2010 |
Rank |
County |
Estimate |
Percent of State Migrants |
Percent of State Population 2015 |
|
1 |
Miami-Dade |
33,903 |
25.1 |
13.3 |
1 |
Miami-Dade |
39,531 |
26.2 |
13.4 |
|
2 |
Broward |
16,722 |
12.4 |
9.3 |
2 |
Broward |
22,970 |
15.2 |
9.2 |
|
3 |
Palm Beach |
11,237 |
8.3 |
7.0 |
3 |
Palm Beach |
12,057 |
8.0 |
7.0 |
|
4 |
Orange |
8,715 |
6.4 |
6.1 |
4 |
Orange |
11,753 |
7.8 |
6.3 |
|
5 |
Hillsborough |
7,516 |
5.6 |
6.5 |
5 |
Hillsborough |
10,175 |
6.8 |
6.7 |
|
6 |
Pinellas |
5,872 |
4.3 |
4.9 |
6 |
Pinellas |
4,759 |
3.2 |
4.8 |
|
7 |
Duval |
3,646 |
2.7 |
4.6 |
7 |
Lee |
4,745 |
3.2 |
3.4 |
|
8 |
Lee |
3,533 |
2.6 |
3.3 |
8 |
Duval |
4,042 |
2.7 |
4.6 |
|
9 |
Collier |
3,375 |
2.5 |
1.7 |
9 |
Collier |
3,212 |
2.1 |
1.7 |
|
10 |
Polk |
2,812 |
2.1 |
3.2 |
10 |
Polk |
2,919 |
1.9 |
3.2 |
Figure 2 displays the largest inflow from abroad to Florida counties by region of origin for 2005–2009 and 2010–2014. Similar to Table 2, we aggregated countries of origin into seven regions of the world (Africa, Asia, Caribbean excluding Cuba, Central America, Europe, Oceania, and South America) plus Canada, Cuba, and Mexico. In 2005–2009, for 17 counties the largest inflow originated in Asia, followed by Mexico (16), and Europe (11). By 2010–2014, in 24 counties the largest inflow was from Asia, followed by Europe (15) and the Caribbean (12). These county-level changes are similar to the statewide trends discussed above, which showed both numeric and percentage declines for migrants from Mexico, while the opposite was true for migrants from Asia and the Caribbean. Interestingly, even though both the numbers and the share of migrants from Europe declined, there were 4 more counties in 2010–2014 where the largest flow was from Europe than in 2005–2009. There was not a single county in Florida where the largest inflow from abroad originated in Africa or Oceania in either period, which is not surprising given the relatively small statewide numbers of migrants from those regions.
Figure 2 shows some geographic clustering by region of origin – for example, migrants from Europe and Canada dominate along parts of the Gulf Coast and in Central Florida – but for many counties the top sending region changed from the first to the second period. In fact, for only about one-third of all counties did the largest inflow from abroad come from the same region in both periods. Some of that clustering is an artifact of the PUMS data which, as stated above, are only available for PUMAs and not for counties; PUMAs for smaller counties often include two or more geographically adjacent counties. Furthermore, especially for the smaller counties, the size of the migration flows involved can be quite small, and since the PUMS data are based on a small sample, one needs to be careful interpreting the results.
Figure 2. The Largest Inflow from Abroad to Florida Counties by Region of Origin, 2005–2009 & 2010–2014
a. 2005-2009

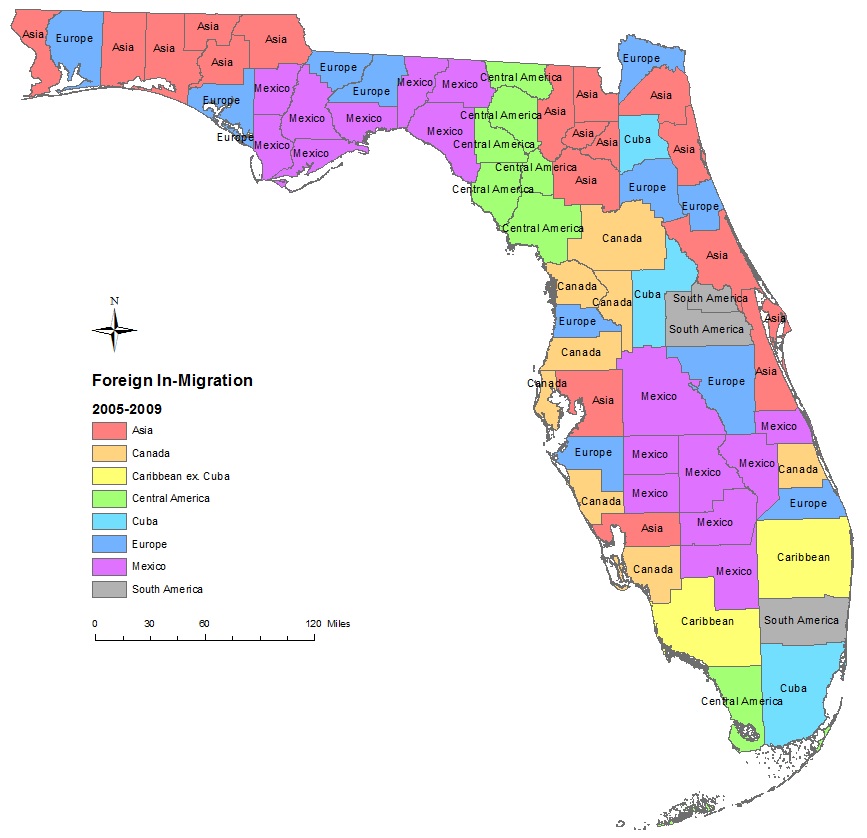
b. 2010-2014
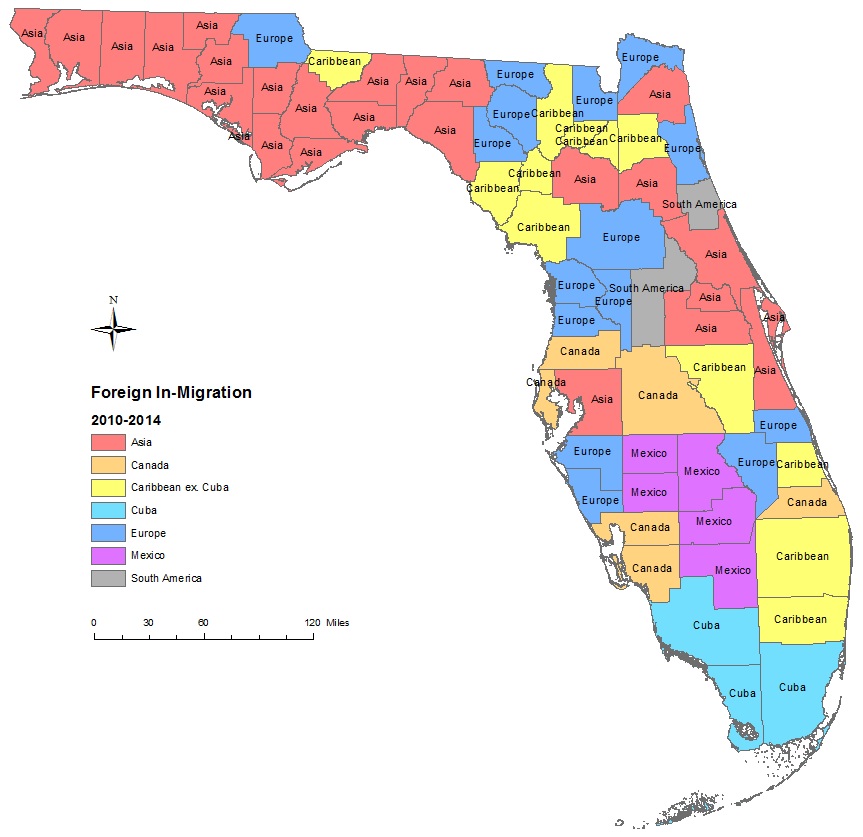

There is also the issue that migrants from the same region can represent different groups for different counties. For example, it is likely that for many of the counties in the Florida Panhandle the inflow from Asia reflects redeployment of U.S. military personnel; in contrast, in Alachua County, it would be college students, especially from China. We also note that we did not include migration from Puerto Rico in Figure 2. Had we included flows from Puerto Rico, in 13 counties this would have represented the largest flow in 2005–2009 (11 counties in 2010–2014); in Orange, Osceola, Polk, and Volusia counties the flow from Puerto Rico was larger than the flow from any of the regions shown in Figure 2 in both periods.
To summarize, Florida has experienced ups and downs in population growth since 2005, which were primarily caused by changes in migration, both domestic and foreign. Migration from abroad fluctuated less than domestic migration over that period. There were some shifts in the origins of foreign in-migrants both statewide and at the county level. The PUMS data provide a lot of detailed information about demographic changes on a timely basis. However, due to the small sample size of the survey, the margin of error associated with PUMS estimates can be quite large, particularly for small areas and small demographic groups; consequently, the results need to be interpreted with caution. Nonetheless, we believe that the migration patterns highlighted in this article can provide valuable insights into population changes resulting from foreign in-migration for Florida.